Molecular Networking
Uncovering the Dark Matter of the Metabolome
Warning: the following contains mass spectrometry jargon. If you’re unfamiliar with terms such as MS2 spectra or untargeted metabolomics (or you just want to brush up) see our metabolomics resources.
Untargeted metabolomics has revolutionized our understanding of metabolism. We now know that a single organism can produce millions of small molecule metabolites, many of which are still unknown. But while untargeted metabolomics promises an unbiased view of the entire metabolome, discovering the chemical identity of an unknown compound can prove elusive.
Let’s start with a standard untargeted metabolomics experiment: measuring differences in the urine metabolome in health and disease. After many months of recruitment, painstaking sample collection, and instrument runtime, you receive a data table with a list of metabolic features and their relative concentration in each sample.
Excited, you throw all your best cutting-edge statistical models at the data and identify hundreds of metabolic features that can predict disease. The bad news? They’re all unknown (plus maybe hippurate).

As it turns out, you’ve been working with a data table where each metabolite was represented by a number (what we would call a feature ID). But what molecule does each number refer to? Your friendly mass spectrometrist has provided you with an annotation file that maps your feature IDs to the names of metabolites, but only about 10% of your IDs actually map. The rest are filled with the dreaded N/A.
So what now? This example illustrates one of the most common issues with untargeted metabolomics - library annotation. To understand which MS2 spectra correspond to which metabolites, we match experimental MS2 spectra to a library of spectra from known compounds. If your compound of interest isn’t in your spectral library, then you won’t get a match. While this problem can theoretically be resolved by expanding spectral libraries to include more compounds, even libraries with >750,000 spectra only annotate 10-15% of compounds in human samples. If you’re looking at plants or other animals, the annotation rate can be even worse.
At this point, most people focus on the handful of metabolites with library annotations (one of the reasons there are so many papers about hippurate). But this strategy ignores most of the interesting metabolites in your dataset. So how can we gather structural information on a metabolite without having a library match?
Enter Molecular Networking. Very basically, molecular networking groups metabolites based on their structural similarity. Here’s an example:
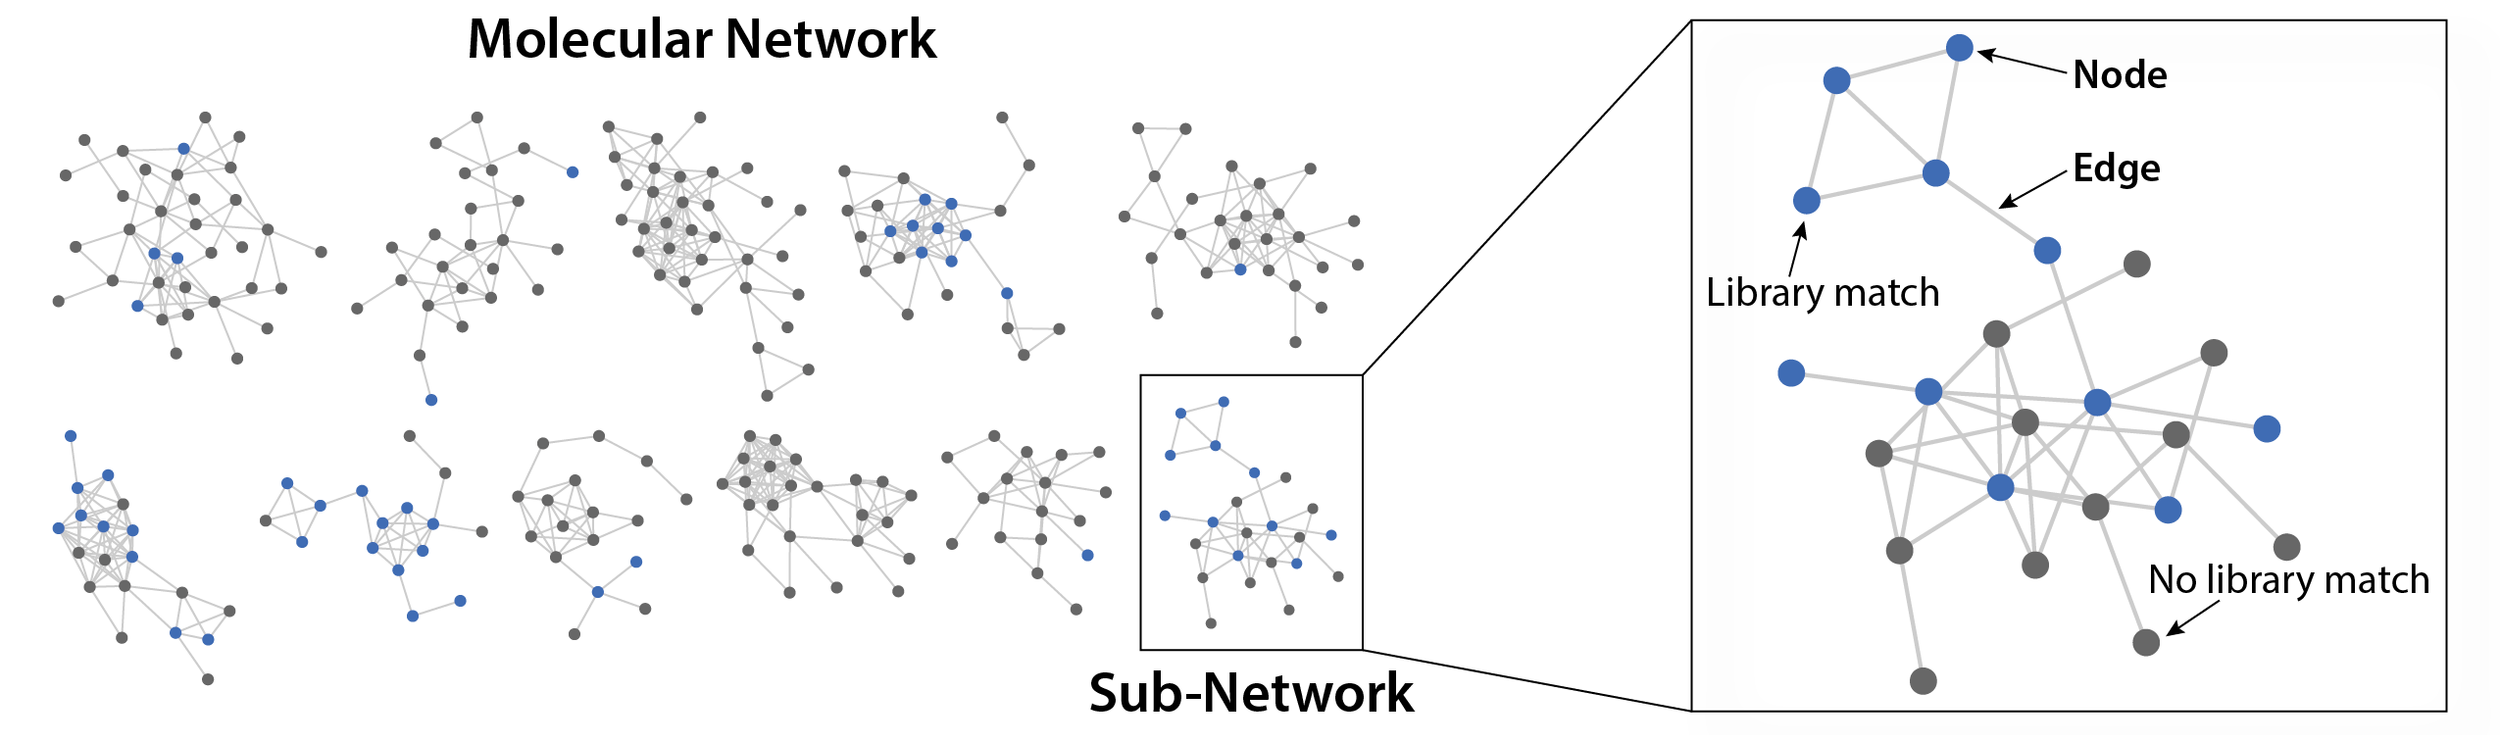
As you can see, a molecular network is composed of nodes (circles) and edges (lines). Each node corresponds to a metabolite, while the edges between them indicate that they share a similar chemical structure. Most of the time, a molecular network will organize into sub-networks, which we call molecular families. Generally, all metabolites in a molecular family will belong to the same class of compounds, such as sugars or lipids.
You’ll also notice that nodes are colored blue or gray. These colors indicate whether the node had a library match. This can provide invaluable information about an unknown compound of interest. Let’s take the following example:

Here we have a molecular family with both annotated and unannotated nodes. The blue annotated nodes all match to bile acids - a class of compounds that share a similar core structure. Thus, it is highly likely that our unannotated nodes are also bile acids. A manual inspection of the MS2 spectra confirms this hypothesis, as our unknown metabolite shares a large number of peaks with one of our annotated bile acids.

Molecular networks can do more than just tell you which library compound is most similar to your unknown metabolite of interest. It is also possible to layer additional information onto these networks, such as metadata on sample type, disease state, or bioactivity. Here we have layered sample information onto the previous network. As you can see, while most of these molecules show up in samples from people with both omnivore and vegan diets, our unknown metabolite is only found in vegans.

These visualizations can quickly and easily identify novel molecules associated with disease or a modified natural product with increased bioactivity.
There are so many ways to use a molecular network to uncover the dark matter of the metabolome. Check out our step by step instructions on how to create and investigate your own molecular networks in Ometa Flow in the accompanying technical documentation.
Advanced Usage: There are many considerations that go into creating a molecular network, such as feature finding, clustering methods, and how to calculate spectral similarity. For a more in-depth discussion of these issues, please refer to our metabolomics resources.
Want to try it out for yourself?